

We just finished our summer vacation, but that‘s no break from feeling the impacts of global warming. This year we crossed the Austrian Alps and the Appenin mountains in central Italy with our bikes – but where were the ice-covered peaks and why was Italy so hot? Some thoughts on the basic physics involved and why climate change may already be more severe than what some models anticipate.
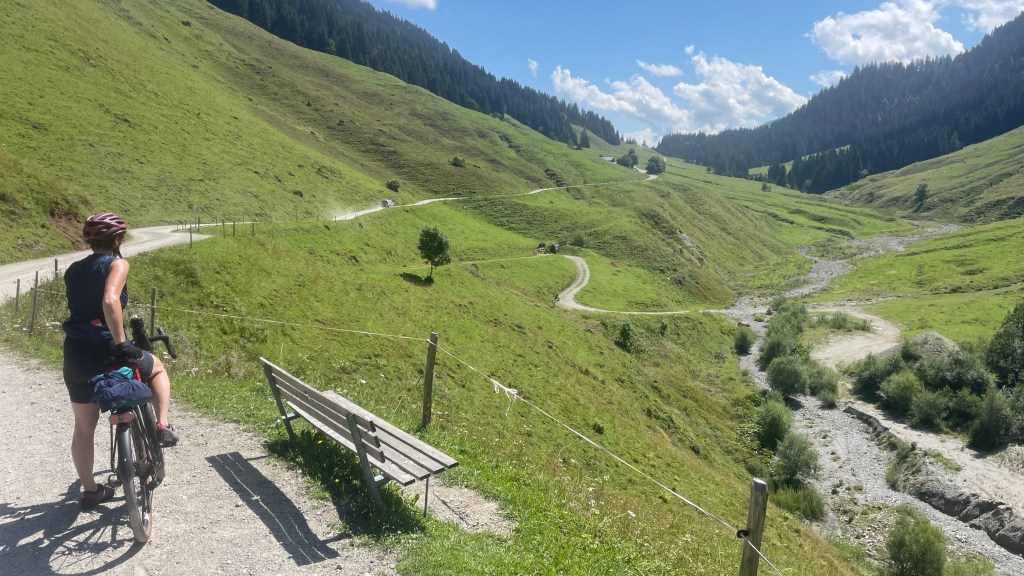
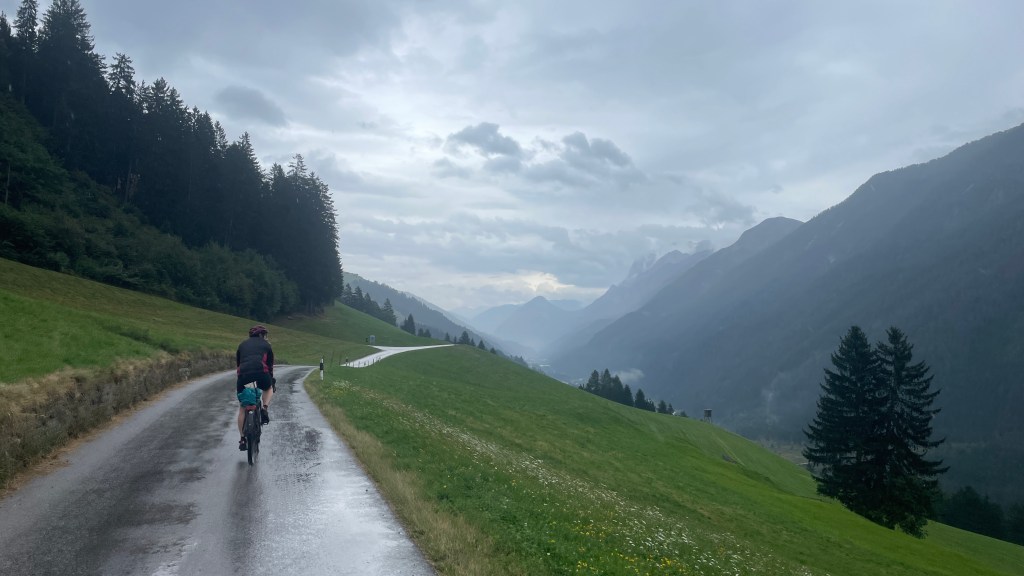
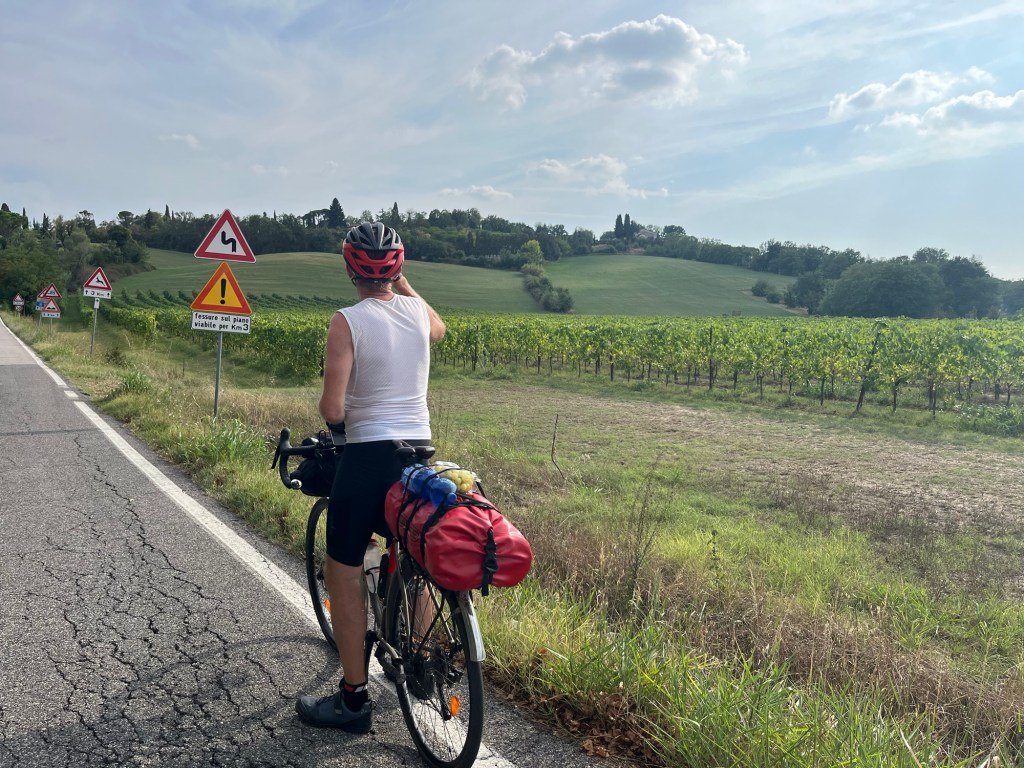
This summer, we opted for a bike tour to cross the Alps and go all the way to Umbria in central Italy. We talked about doing this for a while, and last year we decided to do it this summer and planned things. Overall, it was a great trip – going by bike has a very different feel of the landscape you are travelling through. We enjoyed the quietness in nature, saw plenty of wildlife, and enjoyed the occasional breaks on benches with great views, in bars in the villages we crossed, or at the beach.


But we also saw and felt the impacts of global climate change. While we were on vacation, global warming does not take breaks but presses forward full steam ahead – no matter what fake news, deniers or Russian propaganda wants you to believe. I am certainly not an alarmist and try hard to stay optimistic, but I increasingly get the feeling that we have underestimated the impacts of global warming by quite a bit. I think there are relatively simple, physical explanations to explain this, and riding the bike gives you plenty of time to think more about these. In this blogpost I want to focus on two of the observations related to global warming and explain them with basic physics.
The dying glaciers of the Grossglockner
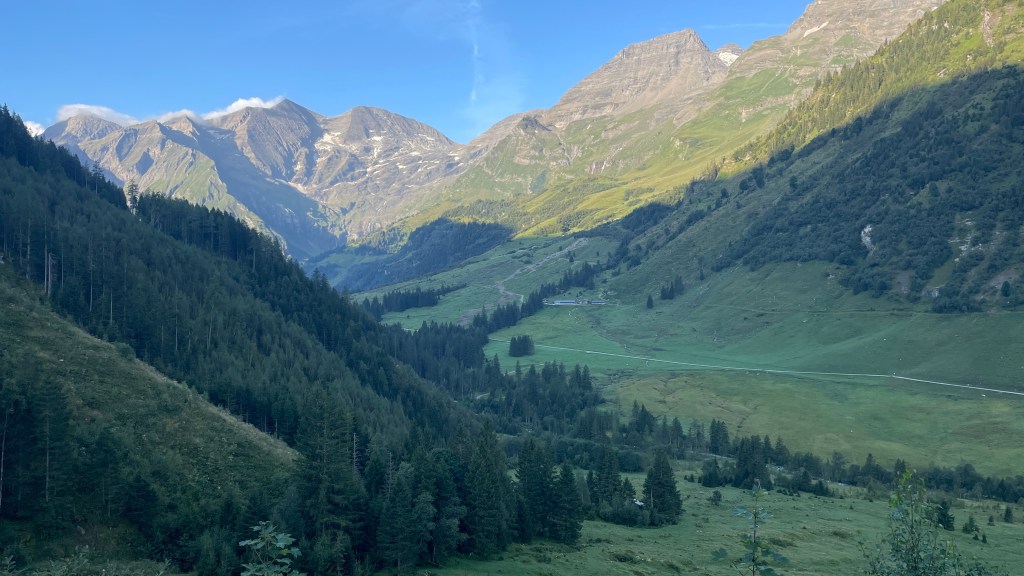
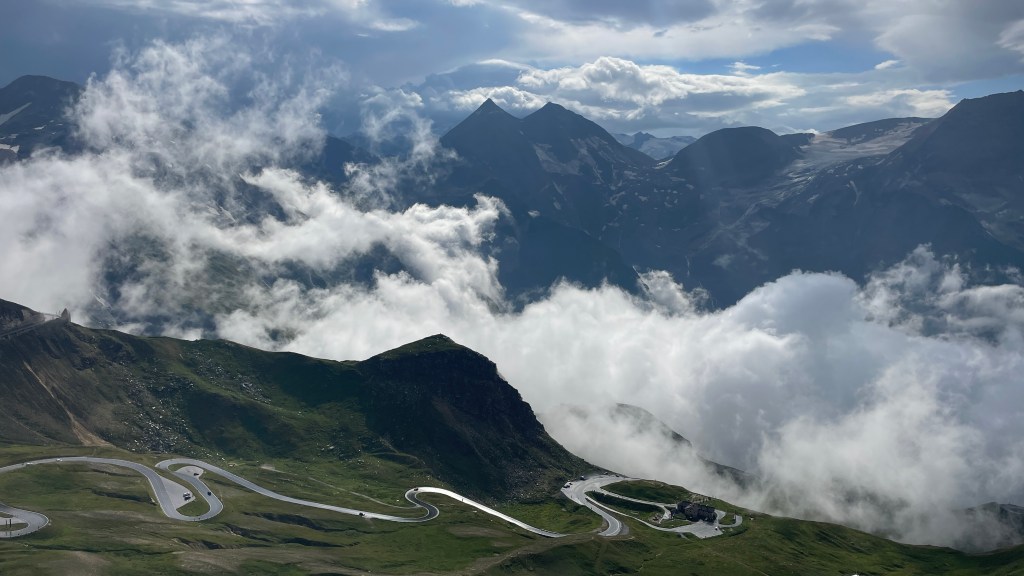
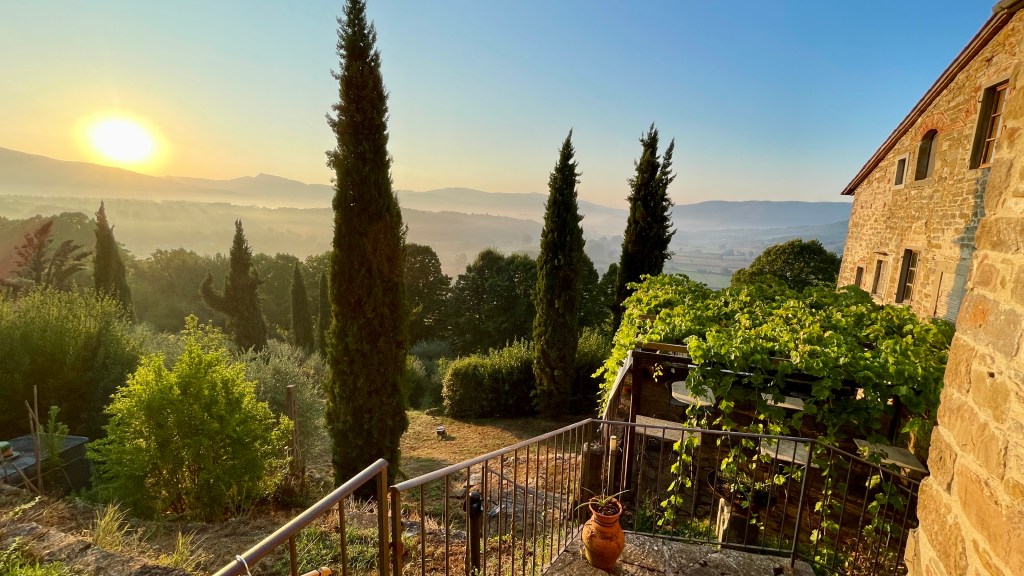
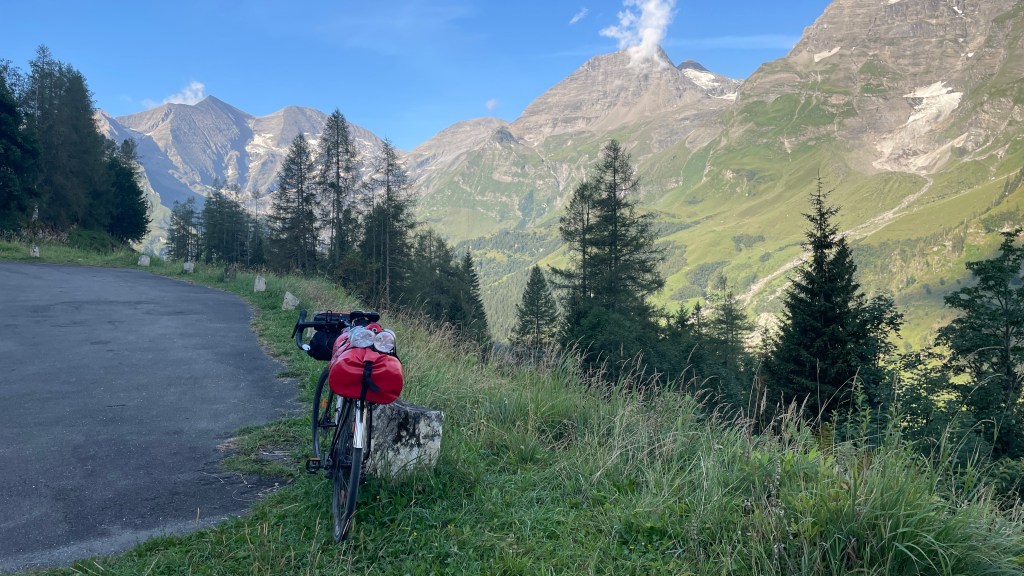
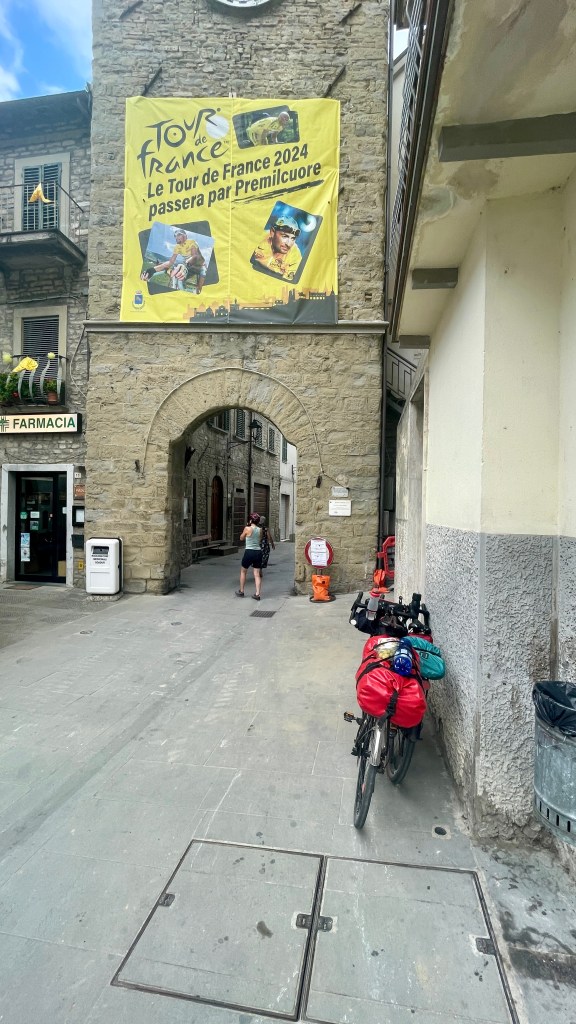
One observation relates directly to the Alps. After starting our tour in Rosenheim in Bavaria, we went into the Alps, crossing the main ridge via the Grossglockner pass. Quite a climb to more than 2500m altitude, although more challenging was the steepness of the road (average grade of 12%). The road climbs up a beautiful mountain valley – and at the mountaintops, we could only see small bits of dark greyish ice – fragments from the glaciers that once topped these mountains. How sad to see!
For me, the immediate question is why: Why have the glaciers already retreated so much? A look at meteoblue weather service shows that the Grossglockner has warmed steadily by almost 3 degree over the last 40 years – not since preindustrial times, but since 1980! The rapid retreat is also well documented by Austrian glaciologists. Why is this warming trend so extreme?
The ice-albedo feedback may be part of the answer, but I think there is something else, more general, more hidden, more profound, and more widely applicable: the changes in the atmospheric window. The atmospheric window is at the core of global warming. It describes a range of wavelengths around 8-20 micrometers for which the atmosphere is relatively transparent, that is, where water vapor does not absorb (in blue in the Figure, redrawn from the wikipedia page). It happens to be located right where the peak of emission from the surface takes place (purple in the Figure), and right where an absorption band of carbon dioxide lies that partly overlaps with water vapor (in red).
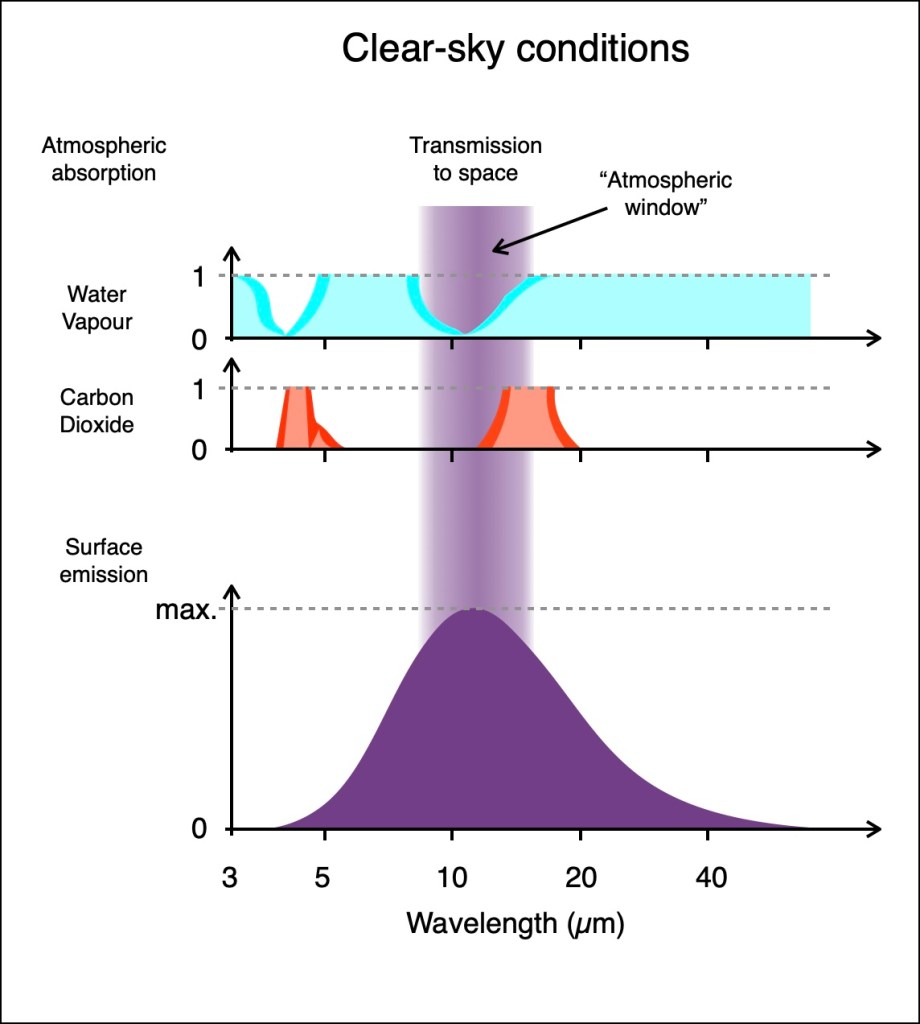

The consequence of this atmospheric window is that some fraction of the emitted radiation from the surface is not absorbed by the atmosphere, but directly exits to space (“transmission to space”, shaded in purple in the figure). This cools the climate system. Otherwise, this radiation from the surface would be absorbed within the atmosphere, and then reemitted into space, but also back to the surface. That emission back to the surface, the downwelling radiative flux, that represents the atmospheric greenhouse effect.
The size of the atmospheric window depends on the amount of water vapor (blue in the Figures). The more water vapor is in the atmosphere, the broader the various absorption bands of water become, and the narrower the window (see darker blue shading in the Figure). This should result in a stronger response at colder temperatures to changes in CO2, because then there is less water vapor in the atmosphere. The window is more open, and changes in the CO2 absorption band play a more important role. Colder regions should thus be more sensitive to a change in CO2 than warmer regions.
Keep in mind that this effect plays out when there are no clouds, because water droplets (instead of water vapor) absorb extremely well across all wavelengths in the infrared range (Figure on right, black color, see also this wikipedia article). This effect of clouds naturally makes the interpretation more complex, and may be a bit counterintuitive. When clouds are present, the greenhouse effect is particularly strong – after all, water droplets absorb and emit very well, so the re-emission back to the surface is comparatively high. This is an effect one can easily notice on cloudy nights, which are typically milder than starry nights. But the sensitivity to CO2 should be reduced with clouds, because there is no atmospheric window. The presence of clouds have thus a modulating impact on the sensitivity to enhanced CO2 concentrations on surface temperature.
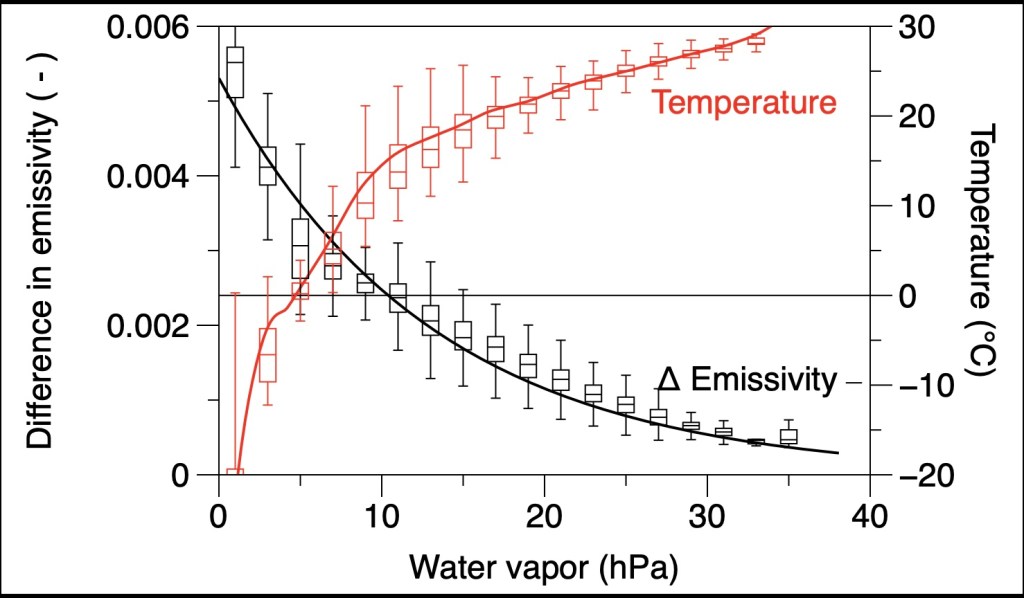
We can make this discussion more quantitative with the semi-empirical expression for the flux of downwelling longwave radiation by Brutsaert (1975). This is an equation that estimates this flux from weather station data, using a combination of theory and empirical parameterizations. We recently evaluated it using more current datasets (Tian et al., 2023 – see also this blogpost). Brutsaert expressed this radiative flux as the product of an emissivity (which depends mostly on water vapor pressure) times σ T4 (the emission according to the Stefan-Boltzmann law, evaluated at the near surface air temperature). Note that this expression uses weather station data as proxies for the total water vapor and heat content of the atmosphere – it is not the 2m height that emits all the radiation to the surface. In any case, this expression is quite useful. I recently used it to reconstruct time series of downwelling radiation for Germany (see e.g., this video and blogpost), and we previously used it to explain temperature trends in China (Du et al. 2020, also this blogpost and more described further below).
Unfortunately, the Brutsaert equation does not include the effect of CO2 explicitly. With a colleague from the US, we did some preliminary research to figure out how to incorporate this effect in the equation. With radiative transfer calculations, we estimated the change in emissivity solely due to CO2 and found a clear difference, as shown in the Figure below. For cold conditions with low water vapor, the emissivity changes more due to the addition of CO2 than for high water contents (black line in the Figure). It agrees fully with the view described above about the atmospheric window being more open and thus more sensitive to CO2 changes when there is less water vapor in the atmosphere, which is when it is colder. This initial change due to changes in CO2 is quite small, but it is amplified quite substantially by the heating it causes and the water vapor feedback.
So that brings me back to the melting glaciers of the Grossglockner – the Alps, that’s high elevations. The temperatures are certainly lower, the atmospheric column contains less water vapor, and the atmospheric window is more open. Thus, in these regions the surface temperature should be more sensitive to increases of CO2 than lower elevations. Actually a fascinating research topic that our new PhD student Saurabh works on in greater detail, so watch out for more in the near future.
Solar-amplified heating in northern Italy
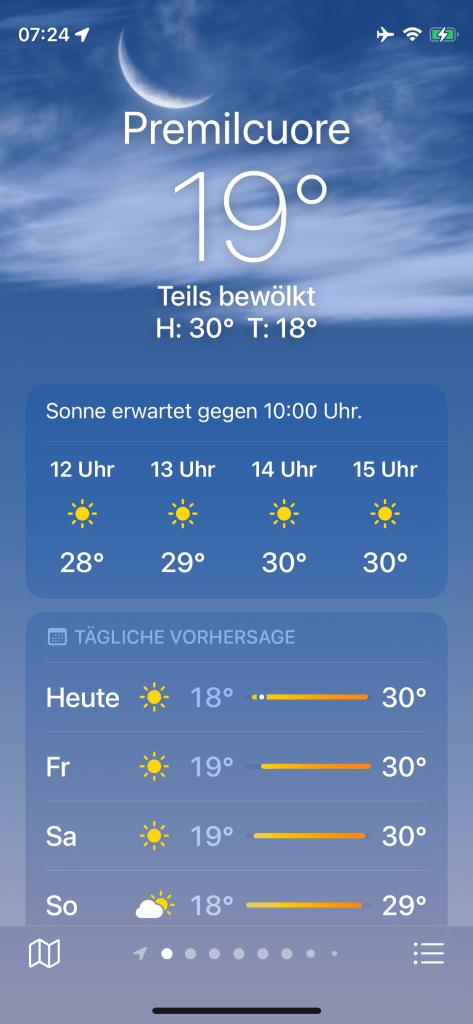
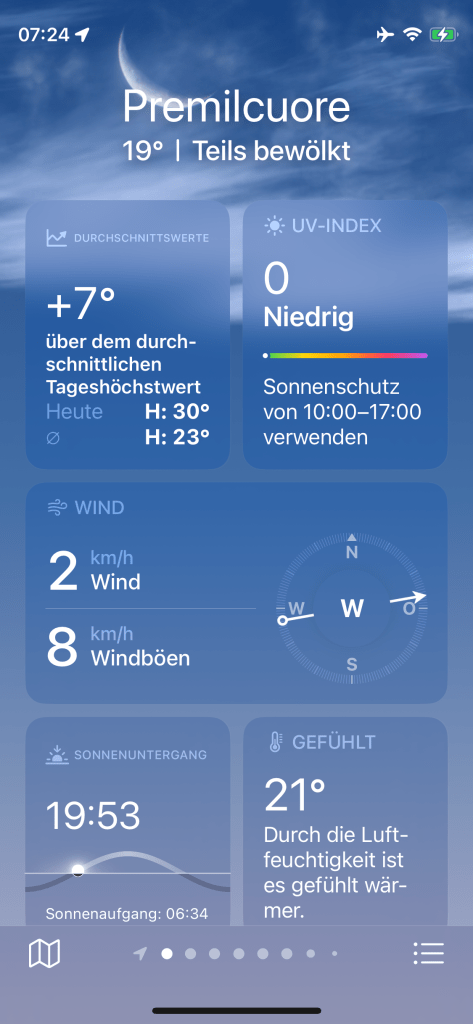
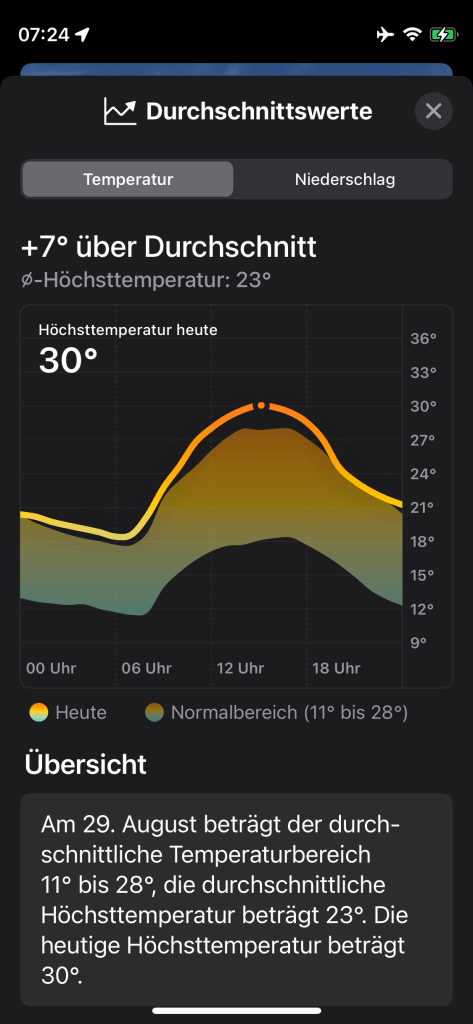
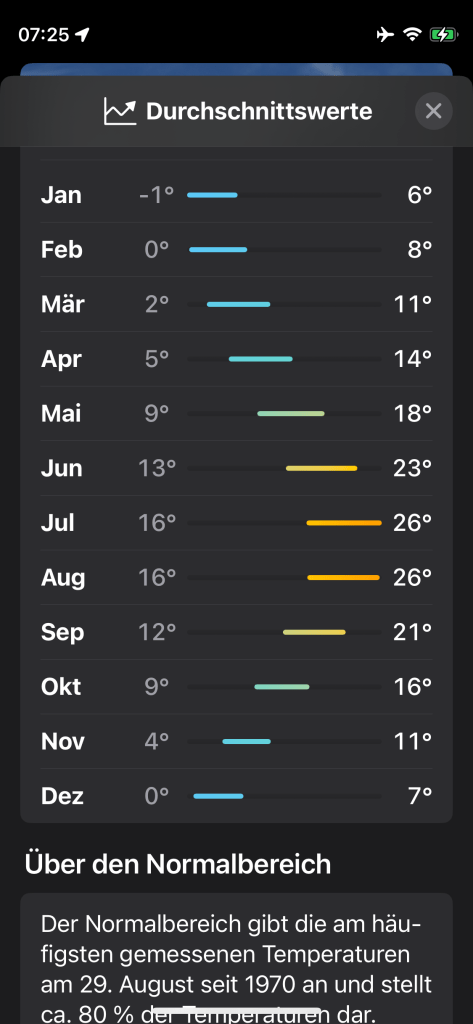
Once we reached the lower elevations of the Po valley, every day was just hot, reaching 30 degrees and more in the afternoon. Even when we entered the Appenin mountains, where one should think that it gets a little cooler. Is this normal? No, it certainly is not! A quick check on Apple‘s Weather App confirmed this (you need to scroll down in the app to see the comparison to climatological averages): In Premilcuore, the temperature was 7 degrees above the mean! This is above the 90% level of the historical observations, and this was not just one day, but this went on for the whole week!
Here I asked myself again why this is. In fact, I think it comes down to two different effects: first, that sunny days are more sensitive to global warming, and second, that the days have gotten sunnier.
The first effect that sunny days are more sensitive again relates directly to the atmospheric window. Italian summers are dry and sunny – typical for a mediterranean climate. No clouds, so the atmospheric window is wide open, and the effects of more CO2 are more pronounced. When you see the absorption bands within the atmosphere, this effect actually should be quite obvious, but as far as I know, it is not widely recognized. I first learned about it myself when we had Muye, a Chinese PhD student, visiting us a few years back. He analyzed historical weather station data from China, and found a very clear signal of sunny days having warmed considerably more than cloudy days (Du et al., 2020 – in the paper, we referred to these days as non-rainy and rainy days, because we used rainfall data to classify days into sunny and cloudy; see also this blogpost). In the discussion, we used the Brutsaert equation (or, better, the extension by Crawford and Duchon (1999), who extended it to include cloud effects) to explain this clear signal in the observations. So, actually, this effect is being described, in the paper of Muye.
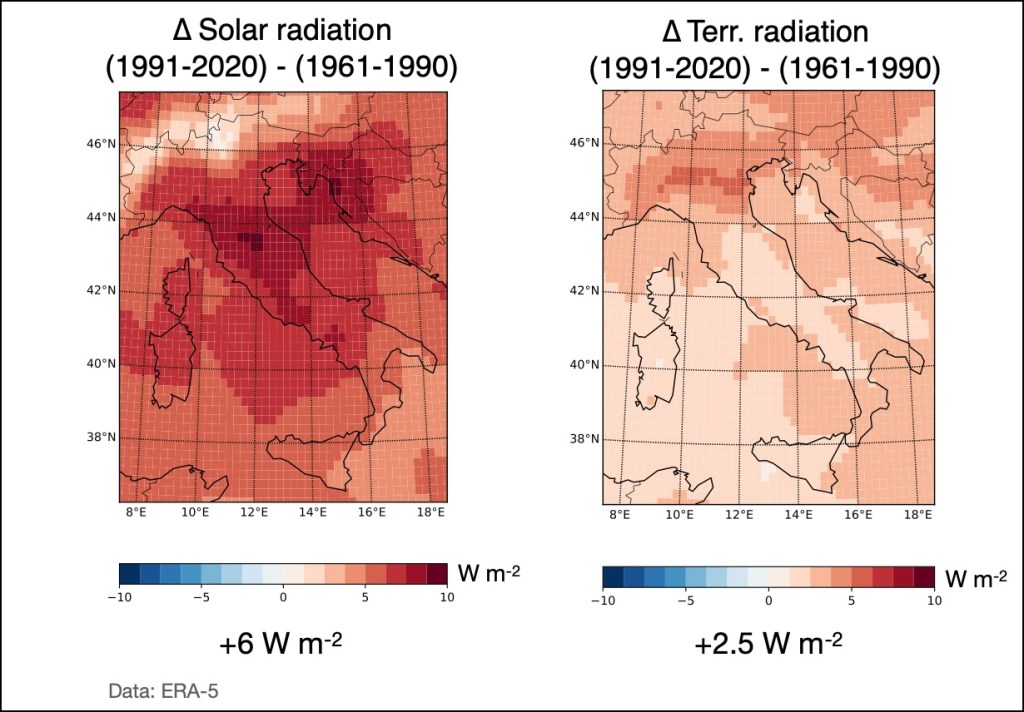
The second effect I think has to do with the acceleration of the hydrological cycle. Warmer air can hold more water vapor, and once it condenses, the released heat is the fuel for moist convection – the process that forms clouds, causes rain, but also generates motion and draws in more vapor. With more water vapor in the air, moist convection becomes more powerful, sucking in more moisture, so that rainfall events become more intense and shorter, and clouds are probably going to live shorter (see also this video and blogpost on global warming and droughts in Germany, also described here). Hence, days become more sunny, even when mean rainfall has not changed by much. And solar radiation has increased quite a bit over Italy, more than the downwelling longwave radiation. I include here two plots to show this (see below), which I analyzed a few months ago in preparation for a short course on global warming I gave at the University of Firenze.
I think both factors – the greater sensitivity of sunny days and the increase in solar radiation at the surface due to a shorter lifetime of clouds caused by more powerful moist convection – could probably explain a good part of this unusually strong warming. A similar, stronger than expected warming we also found for Germany, also due to an increase in solar radiation at the surface (see also this video, and this blogpost). And, by the way, variations in the output of the Sun are way too small to explain such increases – only a change in cloud cover can cause such great changes in solar radiation at the surface.
Insights
So what do I learn from this? The impacts of global warming are already with us, loud and clear, getting more and more serious. As I recently learned from a fascinating talk by a psychologist (Lea Dohm, see e.g., a column by her here), I should end with options of what we can do about it, because otherwise, one may resign or deny that global warming is real.
So what can each of us do? Well, I believe the key to do something about global warming rests in everyone’s action – what we do, and what we don‘t to – this is up to us. And which habits we can change. So the starting point is clear: burn less fossil fuels, ideally none at all. This means, for instance, to drive less with a combustion-engine car – use the bike more frequently, or use the train. Fly less or, better, not at all. And when you need to buy something new, opt for non-combusting technologies – they are much more efficient anyway, because technology based on combustion is lousily efficient (it is due to the second law, see here). And instead of crossing the Grossglockner pass on noisy and smelly motorbikes (yes, there are a lot of them), use your bike. It immerses you in the landscape – you see, feel, smell and hear the nature around you as you go across the pass, a truly wonderful experience!
