

Evaporation cools, right? What may sound so obvious was the topic of Annu’s PhD thesis: to look into observations and find the effects of evaporation in how surface and near-surface air temperatures vary throughout the day. The results are not quite as obvious, and we learned a lot. Here is a brief summary of her thesis, with its contents spread over three papers. Very nice work!

Looking differently at the diurnal cycle
The starting point of Annu’s thesis was to look at the diurnal variation of temperature at around 160 FluxNet stations and, at the end, in the ERA-5 reanalysis, in a different way. Rather than plotting variations during the day as a function of time, as it is commonly being done, she looked at these in terms of the major forcing – the heating of the surface by the Sun. And it shows a rather intriguing pattern: an almost linear increase of temperature with solar radiation in the morning. This is what Annu called the warming rate. Mathematically, it is the derivative of temperature to solar radiation, while statistically, this rate can be inferred from a linear regression of the data points of the morning hours.
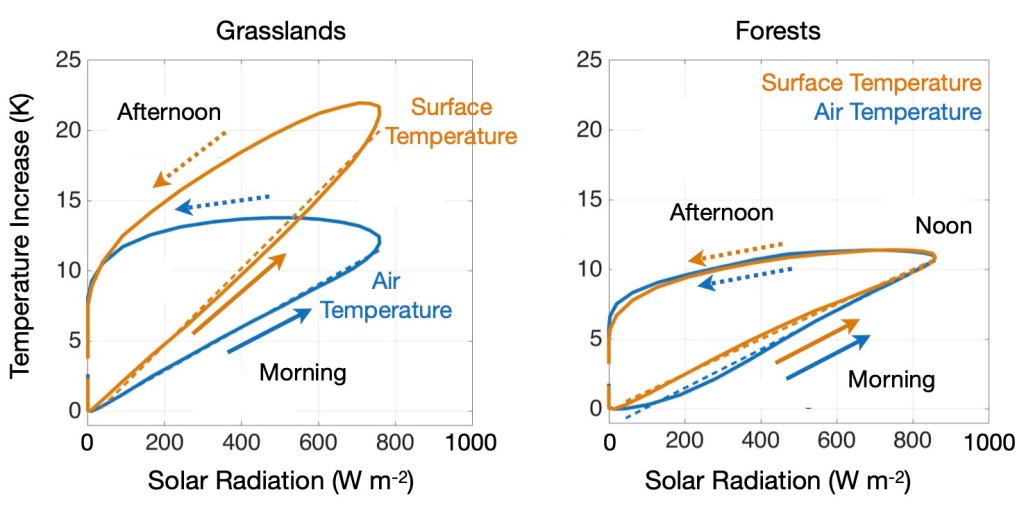
The figure also shows that it matters quite a bit whether we look at the surface temperature, or the near-surface air temperature. The surface temperature is defined as the temperature at which the absorbing surface emits radiation – this is how this temperature is inferred. For a forest, this temperature does not represent the temperature at the ground, but rather that of the canopy. The air temperature is a routine meteorological measurement at about 2 meters above the surface (or, for a forest, above the canopy). And what Annu found is that the surface temperature reacts much more strongly to the heating by sunlight, but only for non-forested sites like grasslands. For forests, the temperatures almost behave the same way. So in other words, for grasslands, the warming rates have quite different magnitudes, but forests show more or less the same warming rates. Why is this so? We’ll see further below.
Effects of evaporation are mostly seen in surface temperatures of grasslands
When looking at warming rates, the major cause of temperature variations, solar radiation, is removed. So Annu next looked at how the warming rates change with evaporative fraction. The evaporative fraction is defined as the ratio of the latent heat flux (the energy equivalent of evaporation) to the sum of the turbulent heat fluxes. It is a proxy for water availability. Moister conditions are associated with a greater evaporative fraction, while drier conditions have a lower evaporative fraction. The change of the warming rate is mathematically expressed as the derivative to evaporative fraction, while statistically, it is again inferred from a linear regression.
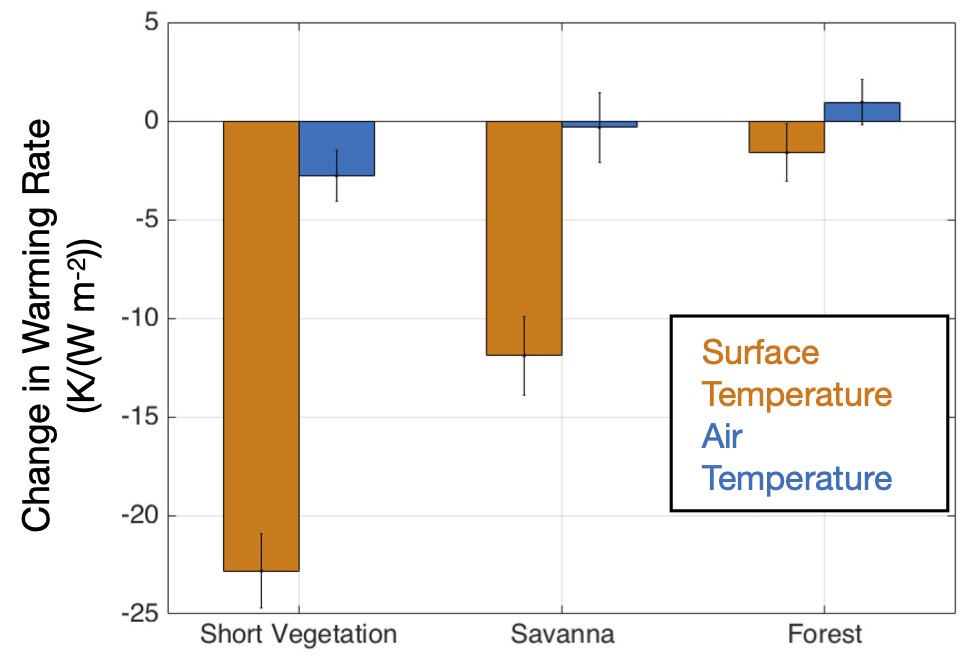
And here, too, Annu found a very interesting pattern: Surface temperatures of grasslands react quite strongly to evaporative fraction. So when more water is available, the surface temperature does not increase so strongly during the day, as one may expect. This is why the change in the figure is negative. But that effect is much, much weaker for air temperature (blue bars), and for forests. So in these cases, temperature shows almost no response to evaporation. Isn’t that interesting?
Physical constraints explain these patterns
Annu reproduced these patterns with two simple, analytical models that are based on two physical concepts: (i) the surface energy balance. It is the constraint from energy conservation, and it means that absorbed solar radiation is balanced by net cooling by terrestrial radiation (emission – greenhouse effect) and turbulent fluxes, which includes the energy equivalent of evaporation. (ii) the energy balance associated with heat storage changes due to boundary layer growth in the lower atmosphere. These models allowed Annu to identify the major factors that explained these patterns.
The weak response of air temperature to evaporation is mostly the result of a compensating mechanism of the boundary layer. During drier conditions, the boundary layer grows faster, so it provides a greater heat storage capacity, which dampens changes in air temperature. The different response of forests is due to their greater so-called aerodynamic conductance. The leaves of forest canopies are much more strongly coupled to the temperature of the surrounding air, so that the surface temperature responds like the air that surrounds the leaves. Annu confirmed this explanation also for the ERA-5 reanalysis dataset for sunny summer months, that is, those times when the surface is strongly heated by solar radiation.
What’s next?
Annu’s work has actually started with quite a different premise – we (Annu, Maik and I) originally thought we could infer evaporation rates from these warming rates (see, e.g., Renner et al. 2016). But now we know better: it is not so simple! Her results show quite clearly that evaporation does not leave such a clear imprint on temperatures as one may think. So there’s lots more to find out!
Annu’s work is already published in two journal articles (Panwar et al. 2019, Panwar et al. 2020), with the last manuscript currently being in review. And she has already started to explore applications of her concepts to the effects of deforestation. Also, she will continue to be around the institute, joining the group of Alex Winkler in the BGI department as a PostDoc.
Again, congratulations Annu, on your doctoral thesis! Overall, I think we had a fun time and learned a lot!
Annu’s papers:
Panwar, A., Kleidon, A. (in review) Evaluating the response of diurnal variations in surface and air temperature to evaporative conditions across vegetation types in FLUXNET and ERA5. Journal of Climate.
Panwar, A., Kleidon, A., Renner, M. (2019). Do surface and air temperatures contain similar imprints of evaporative conditions? Geophysical Research Letters, 46(7), 3802-3809. doi:10.1029/2019GL082248. Also covered in this blogpost.
Panwar, A., Renner, M., Kleidon, A. (2020). Imprints of evaporative conditions and vegetation type in diurnal temperature variations. Hydrology and Earth System Sciences, 24(10), 4923-4942. doi:10.5194/hess-24-4923-2020. Also covered in this blogpost.
Turnbull, T., Renner, M., Panwar, A., Katsikis, N., Kleidon, A., Schindler, A. (2021). Quantifying available energy and anthropogenic energy use in the Mississippi river basin. The Anthropocene Review. doi:10.1177/20530196211029678.
Update in Response to Maarten Ambaum’s comment:

Nice post. I especially liked the first figure; would be good to get a sense of the variance in the underlying data. (Presumably cloud cover rather muddies the water!). Also: Axel, presumably you must be immediately thinking: “heat input, temperature differences, what about entropy production rates?” Looks like a nice piece of work. Congratulations to Annu!
LikeLike
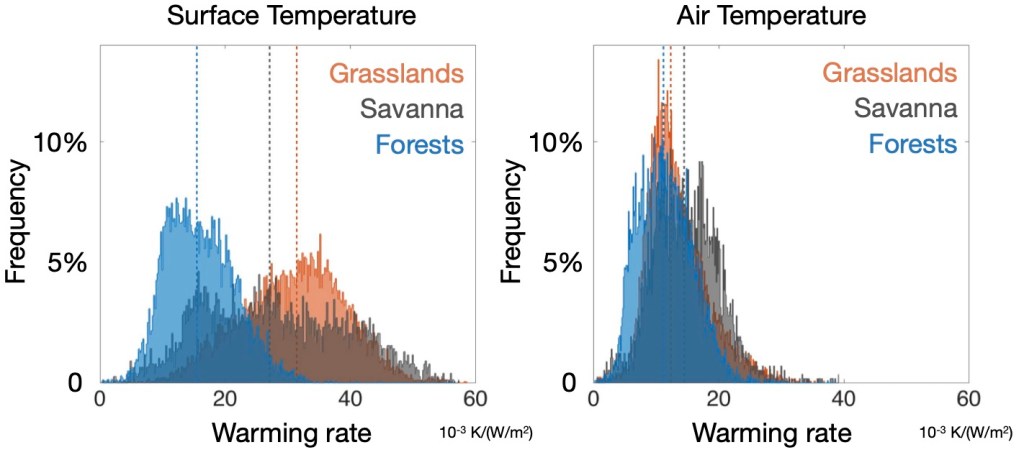
Thanks, Maarten! We have a frequency diagram of the warming rates (Figure 3 in Panwar et al. 2020), I’ll try and add this figure to the post. And yes, we did sort out cloudy days – these are sunny summer days. And, also, yes, I am certainly thinking thermodynamics! Particularly how one can get the increase in boundary layer height with drier conditions (that is, faster growth, the compensation for air temperature increases), that’s certainly must have to do with more power being generated by the sensible heat flux! So a bit more than just entropy production…
LikeLike
Interesting! How was surface temperature measured and was there a comparison of albedo and/or emissivity between the different land cover types?
LikeLike
Surface temperature was inferred from the longwave upwelling flux via Stefan-Boltzmann law. Annu did not consider different emissivities. The albedo is indirectly accounted for in the modelling she did where it is only the net solar flux entering the calculations.
LikeLike
Emissivity of vegetated surface generally ranges within 0.8 to 0.9. Surface temperature is inversely proportional to 4th root of emissivity it will not impact our findings greatly. However, if you change emissivity to a much smaller value for instance to 0.6 we will get slight stronger response ( cooling of additional 1 to 2K) of surface temperature to evaporation.
LikeLike