

Over land, there is a marked variation in surface and air temperature during day and night, with the amplitude described by the diurnal temperature range. What are the main factors that determine its magnitude across regions and how much is it shaped by evaporation? This is what Annu Panwar looked at in her last part of her PhD using FluxNet observations and the ERA 5 reanalysis products, with the results just published online in the Journal of Climate. What this analysis shows is that energy balances go a long way to explain the main influences and that evaporation does not have quite such a strong effect as one may think.
The diurnal course of temperatures over land show a clear and characteristic pattern, especially during sunny summer days. This typical pattern is shown in Figure 1 below, using aggregated summer conditions across regions. The general pattern can be very well observed in the summer when diurnal temperature variations are mainly shaped by the solar input. The early morning hours show the coolest temperatures. Then, as the Sun rises and heats the ground, temperatures increase and eventually reach their maximum. As the Sun sets later during the course of the day, temperatures cool, and continue to cool throughout the night.
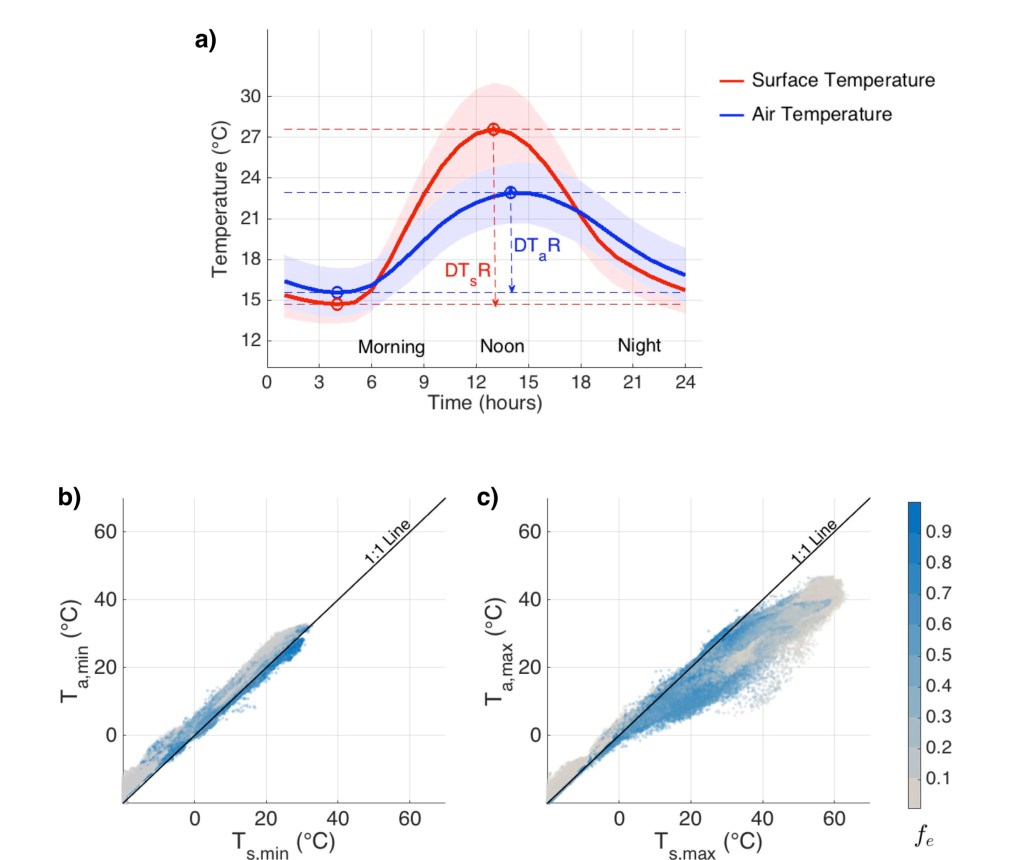
Figure 1: The typical variation of surface (red) and 2m air temperature (blue) during the day (panel a) as well as the covariation between the diurnal (b) minimum and (c) maximum temperatures. The shading in the lower panels shows the so-called evaporative fraction, defined as the ratio of the energy equivalent of evaporation to the total turbulent fluxes. The diurnal temperature range (DTR) describes the difference between maximum and minimum temperatures. Figure 1 in Panwar and Kleidon (2022).
What is interesting about this, and what can we learn from it? Well, notice the difference between the surface temperature (in red) and the air temperature (in blue) that is measured merely 2 meters above the surface? Why are their magnitudes so different, and why are the maximum air temperatures reached later during the day than at the surface? Is it because the land surface reacts instantaneously to solar radiation while air temperatures feel the heat storage of the lower atmosphere? When we look at the minimum and maximum temperatures, we also see something interesting: While the minimum temperatures of the surface and the air vary closely with each other (Panel b in Figure 1), neatly aligned along the 1:1 line, the comparison of the maximum temperatures vary by quite a large extent, as reflected by the scatter (Panel c in Figure 1). Is this because evaporation affects the response of maximum temperatures, but not the minimum temperatures?
Energy balances determine temperature responses
In the paper just published we evaluated observations from the FluxNet observation network as well as from the ERA5 reanalysis product. We evaluated them by using two, very simple models – so simple, that there are just equations and do not require big computers to be evaluated. But the models are not just simple – they are based on basic, physical concepts so that we can use these to infer and interpret the dominant controls on the diurnal temperature range.
The first model describes the surface temperature, which is governed by the physical concept of the surface energy balance (published in Panwar et al. (2020)). It represents the conservation of energy, with the solar energy input and the flux of downwelling longwave radiation (the greenhouse effect) being balanced by thermal emission and the turbulent fluxes of sensible and latent heat (The heat flux into the ground plays a relatively minor role and was neglected). We simplified a few terms and derived from this balance an expression of how surface temperature increases with solar radiation during the morning hours, from the minimum to the maximum temperature. One can then show that there are three terms that dominate this warming rate: (1.) the rate by which the air warms, with greater air warming resulting in greater surface warming; (2.) a term that depends on how well the surface evaporates, with more evaporation resulting in less surface warming; and (3.) a term that depends on the so-called aerodynamic conductance, which describes how well the surface is ventilated and which differs across vegetation types.
The second model we used describes how air temperature warms during the day (published in Panwar et al. (2019)). This model represents the energy balance of the so-called the convective boundary layer, the lower part of the atmosphere that is well mixed during the day because of the surface heating. Heat storage changes in the lower atmosphere are a really important factor that shapes the diurnal functioning of the land surface and its response to change, as shown by our earlier papers (Kleidon and Renner 2017, 2018). It results in atmospheric variables typically having a phase lag compared to solar radiation because they reflect the accumulated heating during the day, while surface variables respond almost instantaneously to the solar heating (Renner et al. 2019). This heat storage increases due to the heating by longwave radiation emitted from the surface and the sensible heat flux, but not by evaporation, because the energy needed to evaporate is only released upon condensation within the atmosphere when clouds form. Another important aspect is that this heat storage does not have a fixed size, or capacity, but that it grows in height during the day when it heats up. To estimate this growth, we need the so-called background lapse rate in the morning to determine how high the heat input from the surface reaches up into the atmosphere.
We then inferred the parameter values that we needed for these models: the maximum in solar radiation during the day, the evaporative fraction, aerodynamic conductance, and background lapse rate, and then compared the estimated temperatures with the observed ones.
These models work very well in capturing the diurnal temperature ranges in FluxNet observations (Figure A2 in the paper). Obviously, there are some biases, after all, it is a really simple representation. These biases can be seen by the spread when comparing estimated to observed temperatures and by the slope of the correlation not being one as it should be, but typically a bit less. But the agreement is nevertheless very good. This agreement can be quantified by the correlation coefficients. These were generally above 70% for air temperatures, and above 85% for surface temperatures. What this tells us is that our models capture the main physical effects that shape the diurnal variation of temperatures over land.
Surface temperatures are shaped by evaporation and vegetation type, while air temperatures mostly by the non-latent energy input during the day

Figure 2: Sensitivity of the diurnal range of (top) surface and (bottom) air temperature to evaporative fraction and how this sensitivity varies with solar radiation. The x axis shows the peak flux of solar radiation during the day. The y axis shows how the sensitivity of the diurnal temperature range to evaporative fraction, which is mathematically expressed as the derivative. The lines and colored ranges are the behavior derived from energy balance models, the symbols with error bars are derived from observations (blue: forests; black: mixed; red: grasslands). The negative values imply that the diurnal temperature ranges decrease with greater evaporation. Figures 8c and 10c from Panwar and Kleidon (2022).
The most important factor shaping the diurnal temperature range is, obviously, the magnitude of solar radiation. We did not explicitly look at this, but focused on how the diurnal temperature ranges of surface and air temperatures respond to evaporation. This is shown in the Figure 2. The x-axis shows the maximum in solar radiation during the day, which is reached at solar noon. The y-axis shows by how much the diurnal temperature range decreases with a greater evaporative fraction, which describes how much of the turbulent fluxes are due to evaporation. The negative values mean that with more evaporation, the diurnal temperature range decreases. But there are important differences in that sensitivity. Surface temperature responds much more strongly to evaporation than air temperature, and depends on the vegetation type. For grasslands (red line in the upper plot) this cooling due to evaporation is much stronger than for forests (blue line), which can be attributed to their difference in their aerodynamic conductance. Air temperatures respond much less, and are not affected by vegetation type. They respond dominantly to the energy input from the surface, in form of the emitted radiation and the sensible heat flux. Evaporation, however, hides some of the radiative heating in latent form, which reduces the input of heat into the heat storage that is formed by the lower atmosphere. Furthermore, its response is much less than for surface temperatures because greater energy input into the atmosphere results in a greater growth of the convective boundary layer, so that air temperatures do not react so strongly. Hence, it is the non-latent energy input from the surface during the day in connection with its effect on boundary layer growth that shapes the responses of air temperatures.
So what?
Overall, what this means is that we can explain much of the diurnal temperature variations by a few, physical concepts and mechanisms. Surface temperatures react immediately to solar radiation input, they react less when more of the surface heating goes into evaporation and thereby into latent form, and they react to how well the surface is ventilated, with a marked difference between grasslands and forests. Air temperatures, on the other hand, do not react immediately, because they are buffered by the large heat storage that is formed by the convective boundary layer. Their magnitude is determined by the heating from below that is not in latent form, but the response is reduced because the boundary layer grows as it heats up. And these mechanisms seem to hold quite generally across different regions.
There are also further insights provided in the paper. On the practical side, the analysis revealed that the ERA-5 reanalysis appears to overestimate the responses of temperatures to evaporation when compared to FluxNet observations (Figure 6 in the paper). That probably means that there are some biases in the land surface parameterisations that can be improved, and implies that some caution should be spent when using ERA-5 in the analysis of, e.g., extreme temperatures or heat waves. While Annu has moved on to a new Postdoc position, we will revisit these results soon again in our research as we try and link these insights to our thermodynamic maximum power approach as well as climate sensitivities on land.
References
Panwar, A., Renner, M., Kleidon, A. (2020). Imprints of evaporative conditions and vegetation type in diurnal temperature variations. Hydrology and Earth System Sciences, 24(10), 4923-4942. see also this blogpost.
Panwar, A., Kleidon, A., Renner, M. (2019). Do surface and air temperatures contain similar imprints of evaporative conditions? Geophysical Research Letters, 46(7), 3802-3809. see also this blogpost.
