
Rainfall events are expected to become heavier as the hydrologic cycle intensifies with global warming. To determine this strengthening, many studies use observed precipitation events and test how these change with observed temperatures. These so-called scaling rates differ from what is expected from theory, showing a decline above temperatures of around 23° – 25°C. This breakdown in scaling makes it difficult to interpret the precipitation response to global warming and its cause further remains unclear. It also raises the question of whether a high-temperature threshold limits the increase in the intensity of precipitation events with temperature. We resolve this in our latest paper by showing that the break in scaling primarily occurs due to radiative effect of clouds on surface temperatures that leads to a covariation between the two variables.
We address this issue in our paper just published in Hydrology and Earth System Sciences (HESS) by Ph.D. student Sarosh Alam Ghausi. We used observations from India and found that the predominant factor causing the break in scaling is the radiative effect of clouds on surface temperatures. Rainfall events are accompanied by clouds, and make the surface colder by reflecting more solar radiation. This cooling by clouds during precipitation events makes observed temperatures co-vary with precipitation, with wetter periods and heavier precipitation having a stronger cooling effect. We show that when the cloud cooling effect is removed, the breakdown disappears and the obtained scaling relationship is consistent with what is expected from the Clausius-Clapeyron equation throughout the temperature range (Schematic diagram shown in Figure 1).
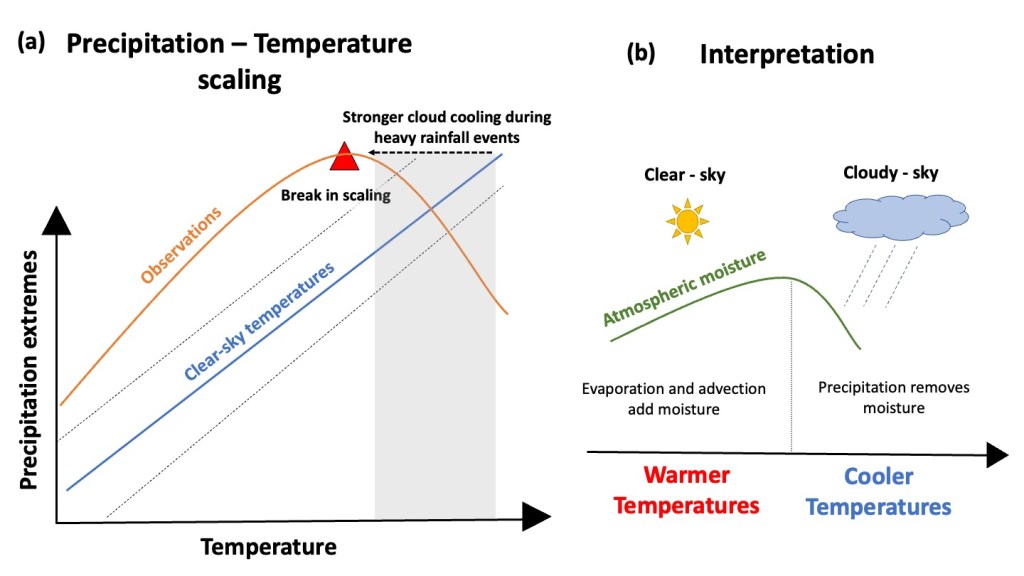
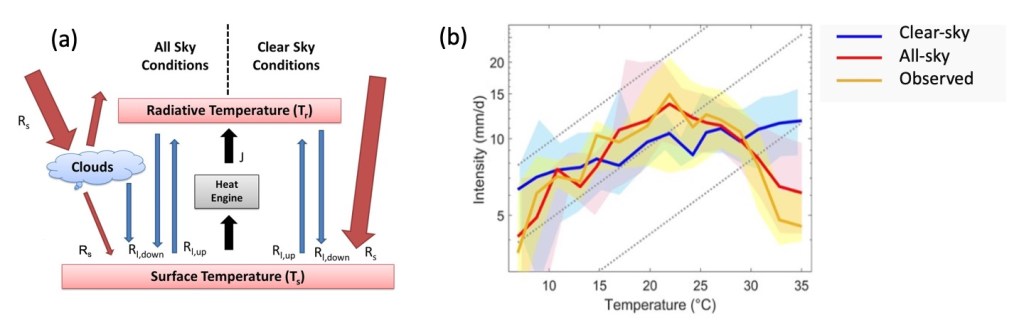
While the cooling effect of rainfall events and its impact on the precipitation scaling had been argued by some studies, the ways to eliminate it had largely been by adopting different statistical methods. In our study, we provide a physics-based approach to removing the cloud radiative effects by using a thermodynamically constrained formulation of surface energy balance. The thermodynamic constraint arises by viewing the turbulent flux exchange as an outcome of a heat engine operating between the hot surface and cooler atmosphere (Figure 2a). By explicitly considering the second law of thermodynamics in addition to the surface energy balance, we show that the atmosphere maintains the exchange of heat and mass such that it maximizes the convective power of the heat engine. Our previous studies (Kleidon and Renner, 2013; Dhara et al., 2016; Kleidon and Renner, 2018; Conte et al., 2019) have already shown the applicability of this constraint which is now further validated here in our present study. We force our energy balance model with “clear-sky” and “all-sky” radiative fluxes. These fluxes are a standard product in the NASA-CERES radiation dataset such that “all-sky” fluxes are representative of observed conditions including the cloud effects while “clear-sky” fluxes are diagnosed by removing the effect of clouds from the radiative transfer. Compounding the thermodynamic constraint on turbulent fluxes together with the radiative fluxes helps us to estimate “all-sky” and “clear-sky” temperatures that include and excludes the radiative effects of clouds respectively.
We then used these reconstructed temperatures to estimate the scaling rates. The scaling relationship using observed and “all-sky” temperatures showed similar scaling behaviour (yellow and red lines in Figure 2b). Extreme precipitation increases close to the Clausius-Clapeyron (CC) rate up to a threshold of around 23° – 24°C, above which the scaling breaks down and becomes negative. This effect was removed when precipitation extremes are scaled with “clear-sky” temperatures that exclude the cloud-cooling effect. The resulting scaling relationship does not show a breakdown and increases consistently, close to the CC rate over the whole temperature range (blue line in Figure 2b). The breakdown in scaling can thus be explained by the cooler temperatures associated with precipitation events. This cooling shifts the precipitation extremes to lower-temperature bins while the high-temperature bins correspond to more arid regions or the drier pre-monsoon season temperatures with lower values of precipitation extremes. We refer to this as a “bin-shifting” effect.
What this implies is that the precipitation sensitivity to global warming is mainly determined by the clear-sky conditions. Sensitivities estimated from observed temperatures are thus likely to misrepresent the response of extreme precipitation to global warming because the cooling effects of clouds make precipitation and temperature covary with each other. The sensitivities obtained with clear-sky temperatures were consistent with physical arguments as well as climate model projections. Our methodology to remove the effects of cloud cooling is also likely to allow us to derive climate sensitivities from observations beyond precipitation events.
References:
