

Winter is coming, snow is falling, and here in Jena we will need gas to heat our homes. Gas prices are at their all-time high, so how much heat do I need and how can I reduce it? I describe a simple, physical way to estimate how much energy I should need to heat our home, and how this can help to find out how effective measures are to reduce energy consumption.
Heating homes is a major part of the primary energy consumption in Germany – after all, winters get quite cold. In 2021, final energy consumption was about 71% of the primary energy consumption of Germany (with a considerable part being lost when producing electricity in thermal power plants; statistics for Germany can be found here). Of that 71%, households consume about 29%, and of that, 68% is used to heat homes. So in total, heating homes constitutes about 14% of the primary energy consumption of Germany.
In the East of Germany where we live, the climate is more continental and winters are colder. Heating homes nowadays is done primarily by the combustion of natural gas, which used to come through pipelines from Russia. Prices have skyrocketed since Putin’s invasion, so how much gas and money are we going to consume by the end of this winter?
As it turns out, estimating energy consumption is relatively simple physics, mixed with a bit of information that is specific to our home, our heating habits, and the outside temperatures. This information we can infer from our last year’s gas bill and from climate data. In this estimate, one can easily see how setting the room temperature to a lower setting and other measures can save quite a bit on the gas bill, save energy and CO2 emissions, and I can make a guess on how much energy we will have consumed by the end of the heating season.
Room temperatures – a balance of heating and heat loss
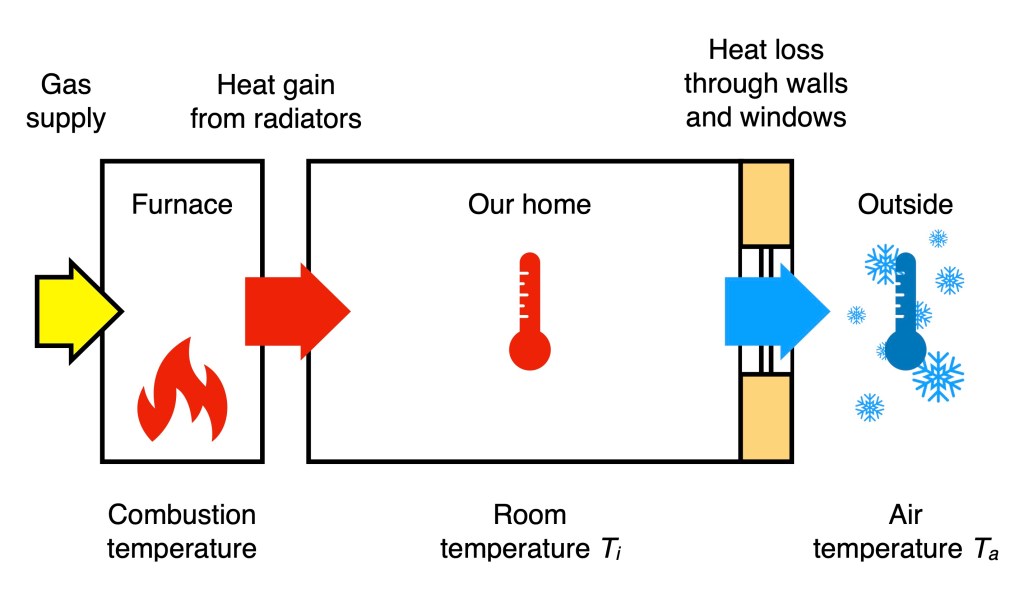
The temperature inside our home results from the balance between the heating added by the furnace that is distributed by the radiators, and heat loss through the walls and windows to the outside (Figure 1). The heat loss to the outside depends on several factors: the conductivity of the building material, the level of insulation, how many layers of glass the windows have, among others. Our walls, for instance, are quite thick – the building was built in 1905 -, but are made of natural stones, which have quite a high conductivity (see e.g., this page on wikipedia). So they lose quite some heat. The different contributions to the total heat loss, the windows and walls of each room, the exposure to sunlight, our choice of which rooms are heated and which are not, among others make a detailed description of the heat loss of our apartment quite complicated.
Yet, the overall heat loss is driven by the temperature difference between the inside and the outside. The inside temperature is controlled by ourselves – we can set it to our likings at the thermostat of the furnace or the radiators. The outside temperature is given by the prevailing weather conditions, which we cannot control. This temperature difference governs the heat loss. To some extent it is controlled by us, but is to some extent also set by the environment in which we live.
This heat loss through the walls is something we cannot avoid – this is where the second law of thermodynamics comes into play. The heat loss is unavoidable because the second law sets the direction of natural heat fluxes such that these act to level out differences in temperature. The heat in the warmer rooms thus inevitably diffuse to the colder outside environment. Hence, we need an energy source that adds heat to the warm side of the temperature difference. This is what we do when our furnace burns gas and produces a source of low-entropy heat to counterbalance the heat loss to the outside. The warmer we want to have it inside, the more we need to consume energy to maintain a greater temperature difference. Hence, our energy consumption depends quite strongly on our choice of room temperature as well as the outside temperature, which we can get from climate records. Using this temperature information, together with our gas bills from the past years, we can thus get a proxy for our energy consumption needed for room heating.
Heating degree days – a proxy for energy demand
This brings us to a well-established concept to characterize the energy demand for heating: heating degree days (see, e.g., this page on wikipedia). For calculating these in the way this is practiced in Germany requires three temperatures: (1) the base temperature (Tb), which describes the outside temperature at which the heating season starts (typically about 15 °C); (2) the room temperature (Ti), which we can choose to be as we like (a typical reference is 20 °C, but we used to set the thermostat to 22 °C in our apartment); and (3) the outside mean daily air temperature (Ta), which can be obtained from a weather station. We then calculate the sum of (Ti – Ta) over those days where the air temperature is below the base temperature (Ta < Tb). The resulting number is then in units of K d – the unit of temperature multiplied by the length of a day. By the way: the base temperature is taken to be lower than the room temperature, because heating also results from the electricity consumption inside the apartment, heat release from human metabolisms and other sources. For a better insulated home, a lower base temperature is used.
Because the heat loss from our home to the outside depends on this summed temperature difference, our total energy consumption should depend on these heating degree days. When choosing a different room temperature (Ti), one can recalculate the heating degree days and estimate quite easily by how much the energy consumption should approximately change.

Figure 2: Seasonal course of near-surface air temperature Ta in Jena. Also marked is the base temperature Tb = 15°C (red dashed line), which describes the outside temperature below which room heating typically takes place. The shaded areas reflect the first and third quantiles of the temperature observations.
To calculate the heating degree days for our home, I used observed temperatures from Jena for the outside temperature, Ta (the data is available here). The mean variation in air temperature over the period 2009-2018 is shown in Figure 2. In this figure, the base temperature Tb of 15°C is also marked by the horizontal dashed line. The heating season is then described by the time of the year when the air temperature is less than the base temperature (Ta < Tb), that is, where the temperature is below the red horizontal line. Note that Jena is quite a cold place to be – the annual mean temperature is merely about 11 °C. Hence, the heating season lasts for quite a long period throughout the year. Also shown in the figure are the monthly means of the year 2022 – which is a bit warmer than the mean, and, for comparison, the mean temperatures from 100 years ago, which were colder, reflecting less global warming back then.
I then calculated the heating degree days for a temperature of 22°C, which is to what we set the thermostat to in the past, and for 18°C, which is our current setting. These yield annual sums of heating degree days of 3688 K d for 22°C and 2716 K d for 18°C – the lowering of room temperatures to 18°C would thus lower our gas consumption by a whopping 26%. Note also that 100 years ago it was noticeably cooler. The annual sum then would have been 4012 and 3040 K d, so we would have needed about 10% more energy to heat the home in the same way we do it nowadays. This is a consequence of global warming. The air temperatures in 2009 – 2018 were 1.8°C warmer than in 1909 – 1918, so that this lowers the need for heating in the winter.
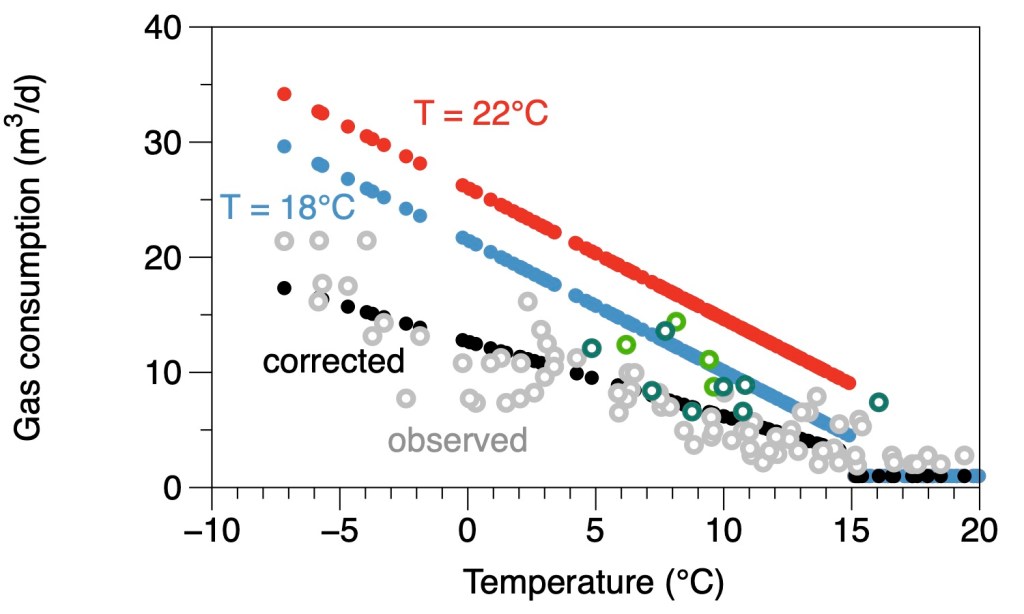
Figure 3: Our gas consumption as a function of outside air temperature for an assumed room temperature of 22°C (red circles) and 18°C (blue circles) estimated from climate data and past gas bills. The black circles represent the estimates for current heating habits, the grey circles mark actual readings (or inferred from interpolation of readings). The green circles are days over the holidays where we had family staying with us and when we heated more rooms.
The reality check: Our gas meter
How does this theoretical estimate of the savings compare to our actual, current gas consumption? If we do not change our heating habits, and only reduce the temperature setting on the thermostat of the furnace, then we should consume roughly those 26% less gas, and this should be noticeable at our gas meter (in Germany, we are old fashioned and still have analog gas meters, so I need to go down into the basement to take a reading). We need, however, a conversion factor that describes how the heating degree days translate into gas consumption. For this, I use our old gas bills and compute a factor of consumed gas per heating degree day. This yields a factor of 1.14 m3/(K d), meaning that we need a bit more than a cubic meter of gas to raise room temperatures by one degree per day. This factor reflects the heat loss characteristics of our walls and windows as well as our heating habits – when, how long, and how much we heat which rooms. With this conversion, I can then calculate how much heating is needed and how much gas is consumed for a given outside temperature. This is shown in Figure 3.
When this factor is applied to the climatological heating degree days, we get our annual gas consumption. When we apply this factor to current temperature data, I can estimate how much gas we should roughly consume given a certain outside temperature and then estimate our consumption for the next couple of months.
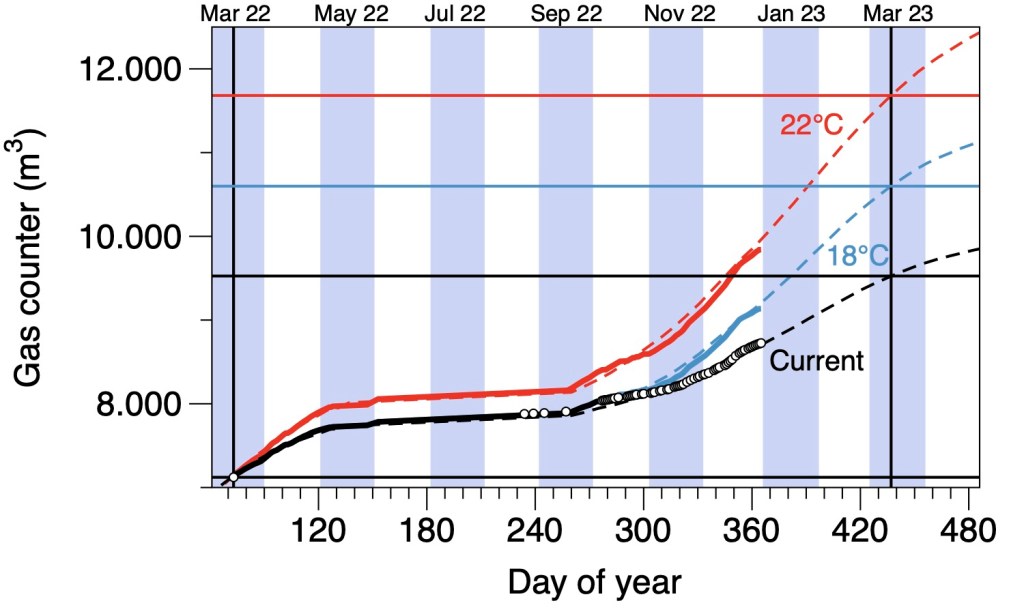
Figure 4: Our estimated gas consumption for the 2022-2023 heating period, starting mid-March 2022 for an assumed room temperature of 22°C (red line) and 18°C (blue line). The dashed lines are estimates based on the heating degree days calculated from the climatology from 2009-2018. The black circles mark actual meter readings, and the black dashed line is an extrapolation of our current heating habits to the end of the heating season.
From the seasonal course of air temperature throughout the year I estimate how much gas we should expect to use for a given room and outside temperature, using the climatology of air temperature shown in Figure 2. I translated this into the reading of the gas meter in Figure 4. Shown is the gas meter reading from the gas supplier – they take a reading once a year in mid-March (open circle). Then, I used the heating degree days for each day from the climatology, converted this by the factor derived from the gas bill into m3 of gas used, and added about 1 m3 of gas for hot water per day, which I derived from summer-time readings when the rooms were not heated. This way, I can then estimate the past consumption up until today, and extrapolate it to the next reading by the gas supplier in mid-March 2023. These estimates are shown in the figure by the red line for a room temperature of 22°C and the blue line for 18°C.
Starting at the end of August, I took more or less regular readings of our gas meter, which are shown by the open circles in Figure 4. They lie quite clearly below the estimate done with an inside temperature of 18°C, so we save more energy than just lowering the room temperature. What did we do? We changed our heating habits. Half of our rooms we no longer heat (it helps that the kids moved out). We installed smart thermostats at the radiators, so that they only release heat when we use the rooms, and we can switch them on or off remotely when we forgot. We hang up curtains again and close these at night. They reduce the heat loss through windows, because this loss happens mostly by absorption and re-emission of thermal radiation. Each additional layer, such as in triple glazing windows, the heat loss is reduced, and curtains add another layer as well. These additional measures apparently reduced our energy consumption quite considerably in addition to the lower thermostat setting.
Given these measures, which reading of the gas meter would I then expect? From the readings done, I estimated that the current gas consumption is about 57% lower than that estimated for the room temperature of 18°C. I used this reduction factor to then estimate the gas consumption for the next few months, shown by the dashed black line in the Figure. It compares quite well to the gas readings. When extrapolated to mid-March 2023, it estimates a remarkable reduction by 47% reduction of our energy consumption to heat our home.
Heating homes in the future
What do we learn from this? The price hike in natural gas certainly made us aware of how much gas and energy we consume. A few years back we had an energy consultant in the apartment, who simply said that it is not worth doing much, as any investment would not pay off. Now, the situation has changed. We can easily see that even these comparatively minor adjustments made a huge difference, not just financially, but also in cutting CO2 emissions. And that temperature observations combined with a litte analysis can predict our gas consumption rather well.
In the near future, we plan to do more: add insulation, and, in the longer run, replace or supplement the furnace with a heat pump. Both means are very common means and there is government support available. Just adding 10cm of insulation cuts down the heat loss through walls by a factor of 10, while heat pumps produce room heating with much less electrical energy than conventional means. Both of these link back to the picture of the factors that control our room temperature shown in Figure 1. With added insulation, the heat loss to the outside still depends on the temperature difference, but yields a lower flux, so less heat input is needed. And the heat pump can save a lot of energy, because we do not actually need the very high combustion temperature of the furnace to heat the room, which is heat with very low entropy and, actually, quite wasteful. After all, one could use this gas to generate electricity at a decent efficiency before it turns into heat. For heating our rooms, all we need is a little work to make outside air a little warmer, and this is what a heat pump does quite a bit more efficiently than by heating with fossil fuels. These energy savings would go on top of the roughly 50% that we already reduced.
What this means is that changing heating habits, adding insulation, and converting to more modern technology like a heat pump will be able to reduce the energy consumption for heating homes quite substantially. A reduction of 50% – as in our case by just changing our habits – and more seems now quite plausible to me. This lowers our the need for Russian gas and it would make a notable contribution to lowering the emissions of carbon dioxide.
How to do it yourself
You can repeat this estimation yourself relatively easily. What you need is:
- Temperature observations for the place where you live. In Germany, the German weather service makes the station data available on the internet (link here). With this and your choice of room temperature, you calculate the heating degree days for a given room temperature. This can be done, for instance, in a spreadsheet.
- Your past gas bills, so you can calculate the conversion factor from heating degree days to your energy consumption specific to your home.
- If you changed your heating habits, you need regular readings of your current energy consumption associated with heating to monitor your consumption. With this, you can then calculate the reduction factor and then extrapolate your expected consumption to the end of the heating season.
Updates
- 09. February 2023: A brief update shows that we are still on track, even though there was some help by mild weather in January. Our current reading of the gas meter is at 9110 m^3, compared to a predicted reading from the climatology and past heating habits of 10928 m^3 – so a savings by 47.5%.
